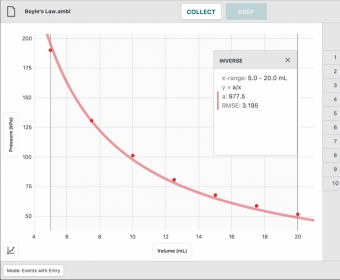
Collect, analyze, manage, share, update and remove content from Vernier LabQuest sensor data. Combine different values to generate graphs, histograms and data tables. Organize relevant data via parameter controls and text annotations. Additionally, calculate tangents and integrals.
Graphical Analysis can be used to collect, share, and analyze Vernier LabQuest sensor data. It can collect data from multiple sensors simultaneously, either with a multiple-channel interface such as LabQuest Stream or by using multiple Go Direct sensors. This program can be useful in calibrating the sensors, analyzing data graphically, and storing previously shared data and analysis sessions.

Comments